
Every day, our Xperts use their expertise to deliver the best possible products and results to our customers. Why not use these skills to improve our internal processes as well?
In our post from May 2, 2023, we already introduced our first internal hackathon presented. The end result provides our sustainability team with a significantly more efficient method for determining our annual carbon footprint. Our company’s support functions also have a wide range of tasks, and the right tools can simplify their processes or help visualize them more effectively. Currently, our data science teams are supporting our HR department in developing a dashboard to visualize the entire recruiting process.
Requirements
Due to the complexity of the recruiting process and the use of various tools, information is scattered across multiple sources. The goal is to create a unified, centralized view of the entire process, from the receipt of an application through to the candidate’s first day at the company.
Collecting data from various sources, transforming it into a standardized and easily processable format, and visualizing this data are among the core responsibilities of data engineers and data scientists. This internal use case offers the ideal opportunity for our Data Engineering and Machine Learning teams to apply their skills outside of project work while also optimizing our internal processes. As a result, not only can we keep a better track of all ongoing recruiting processes, but we can also uncover seemingly hidden opportunities for improvement in the individual steps.
Initial Situation
The idea originated a few years ago; at the time, it initially served as a project for an ambitious student working part-time. The topic offered a substantial scope for in-depth work on requirements gathering, planning, implementation, and the graphical presentation of the results. The project was supported by one of our Data Engineer Xperts. In consultation with the HR department, the exact requirements for the future tool as well as the most important KPIs were clarified together over the course of several meetings.
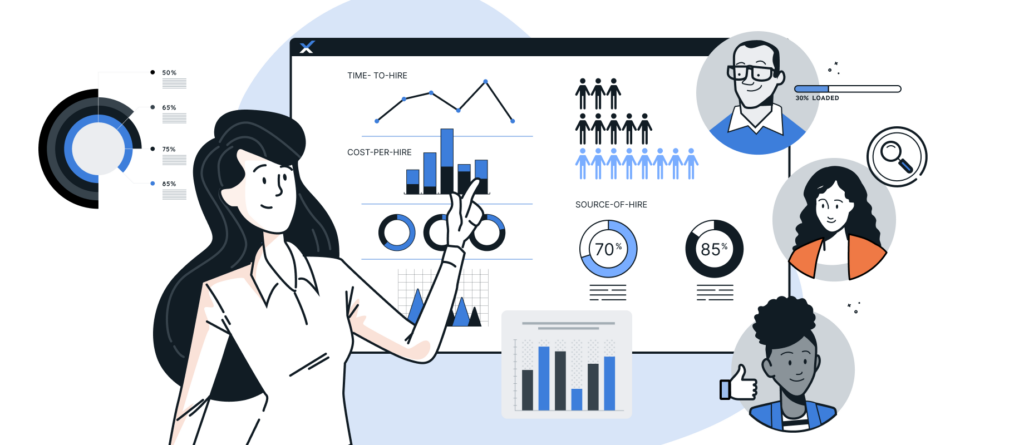
Among the most important KPIs in the recruiting process are, among others, time-to-hire (the time between application and signing the contract), cost-per-hire (recruiting costs divided by the number of new hires), and source-of-hire (which sources yield the highest success rate).
As a first step, only one of the tools used in the recruitment process—namely, JIRA—should be integrated to create a proof of concept (POC). A POC is a scaled-down version of a product concept that serves as proof that the ideas discussed in theory can actually be implemented in practice and achieve the desired goal. To ensure the best possible implementation, we chose the open-source tool Apache NiFi. There, we configured a workflow that periodically queried a REST interface from JIRA, assembled data packets from the responses, performed specific transformations, and then wrote the data to a PostgreSQL database.
This is where the first ETL pipeline was born. ETL is a core principle in the field of data engineering and stands for Extract–Transform–Load. Data is thus retrieved from a source, then transformed into the desired or easily usable format, before finally being made available in a designated data store. In our use case, the data covers everything related to the job postings: the type and number of positions being sought (Development, UXD, Scrum Master, etc.), the current status of the process, the timestamps for all process steps, and much more.
Some fields in JIRA tickets may contain free-text entries, or units of measurement for certain data may need to be standardized. For this reason, the data from the tickets is not imported on a 1:1 basis; instead, as mentioned earlier, it is transformed. This means that the data is either prepared so that it is optimally suited for the desired presentation or so that it is easy to work with to enable future analyses. The customized data sets were then accessed via Microsoft Power BI to provide an engaging visualization of the data for our HR team.
Continuation
Following a thorough evaluation of this POC by our data science teams, the idea was revisited this year. In addition to JIRA, other tools used by HR will now be integrated as well, thereby creating a comprehensive, centralized view of the recruiting process.
To this end, a new student intern, under the guidance of our two data science team leads, takes on the role of project manager and coordinates the implementation process. Currently, task packages are being put together, which will then be worked through step by step by the two specialized teams—Machine Learning and Data Engineering. Since implementation takes place in parallel with ongoing project operations and the participants cannot always work on the tasks at the same time, we follow the Kanban principle rather than Scrum. This allows all employees to complete their tasks within a suitable time frame, and everyone maintains an overview of the current status. Similar to our hackathon, this provides our employees with opportunities to explore not only the project topics but also other methods and tools that fall within their areas of interest. This framework also allows employees to get a taste of other areas of responsibility, such as project management or the product owner role.
Our specialist teams are currently evaluating which software is best suited for implementing the dashboard. For the remaining ETL process, Apache NiFi has so far stood out because its graphical user interface is particularly clear, making the data flow easy to follow. Individual process steps can be started and stopped independently of one another, so that the intermediate result—the transformed data records—can be viewed at any time. In addition, external data sources can be easily tapped into without much effort, and the transformed data can be imported into a separate data store. Apache NiFi provides special processors for this purpose that can be individually configured. For the remaining transformation steps, key insights from the POC can be reused or expanded upon.
Additional challenges arising from the planned implementation include the secure storage of access credentials for the data sources to be connected, as well as the use of version control so that the team can collaborate on transformation scripts and the workflow. The only thing missing now is the visualization tool. The requirements for this tool are that it present the processed information to stakeholders in a visually appealing, simple, and cost-effective manner, with regular updates. It is currently unclear whether Microsoft Power BI will be used for this purpose, as it was in the POC. This is because, in addition to various licenses, a permanently operational data gateway would also be required to provide the dashboard with live updates. Currently, our two specialist teams are researching a more suitable alternative to meet these extensive requirements.
Conclusion
The HR dashboard provides a good insight into how we at IT Sonix understand the specialist team concept. The time spent on specialist teams not only allows our Xperts to build broad-based knowledge in their field so they can stay up to date and ensure the best possible execution of our client projects. This time and the knowledge gained can also be applied to projects within the company to continuously improve our internal processes and our employees’ working conditions.