In various forms, they are part of almost all systems that permeate our world. Whether in finance, transport or the energy sector, behind every application there is a database. Depending on the area of usage, one model is more suitable than the other. However, in all of the aforementioned industries, it can be crucial to know how a particular variable behaves over time. It doesn't matter if it's stock prices, telemetry data or power frequencies, all these values need to be measured at regular intervals.
Time series databases are particularly suitable for this purpose, as they are also able to identify certain trends. Whenever a series of measurements, observations as well as states at certain points in time are needed, it makes sense to utilize a time series database. Advantages of a time series database include not only the organisation of data by time, but also a high number of write operations and queries as well as access to parallel data sources. In addition, it offers great flexibility in the definition/typing of data and has functions for for its automatic deletion and compression.
In our energy projects in particular, we have repeatedly dealt with the advantages of time series databases such as InfluxDB. Together with market-leading energy suppliers, we have developed applications for controlling and forecasting energy shortages and surpluses of virtual power plants. Our customers offer electricity from renewable energies on the balancing power market. Energy suppliers are obliged to provide forecasts of their feed-in and withdrawal in order to be able to maintain the normal frequency in the German power grid at 50 hertz. Since the electricity production of renewable energies depends on various factors, there are often fluctuations that have to be balanced out. To be able to evaluate these fluctuations, we have worked on applications with InfluxDB and Telegraf for our customers.
InfluxDB
InfluxDB was developed by InfluxData specifically for time series data and is designed to work with enormous amounts of time-stamped data. Individual data points in a data series are automatically identified by a timestamp in InfluxDB. Tailored to handle high volumes of writes and queries, InfluxDB is a reliable tool for continuous operations. Especially in the management of data, InfluxDB offers efficient solutions with its functions to merge data (Continuous query) and to delete data (Retention policy). However, before we get into that, we would like to clarify some terms that help to understand how time series data is organised and stored in InfluxDB.
Structure
<measurement>[,<tag-key>=<tag-value>...] <field-key>=<field-value>[,<field2-key>=<field2-value>...] [unix-nano-timestamp]
(using von InfluxDB v1.8 as an example)
The top level is the database. It functions as a container for one or more time series, which are called measurements in InfluxDB. Measurements are strings and their name usually determines which data is recorded (e.g. temperature, speed) They contain tags, fields and the time column. All data in InfluxDB is necessarily and automatically provided with a time column, which in turn contains the timestamp, which indicates the time of the measurement with date and time.
Fields, like the time column, are mandatory in an InfluxDB data structure. They form the key-value pair that records metadata (Field keys) and the actual data value (Field values). Field keys are strings and can be, for example, the energy production, while field values denote the actual measured values that are bound to the timestamp.
Unlike tags, fields are not automatically indexed by InfluxDb. Since each index has to be updated, this has a negative effect on write operations. Therefore, it is recommended to index only those fields that are frequently used for queries and aggregations.
For metadata describing the data points, it is best to use tags. Like fields, they are a key-value pair and consist of tag key and tag value. They are not a mandatory part of the InfluxDB data structure, but are indexed, which is why they are primarily suitable for storing queries.
Another important component for a better understanding of the InfluxDB structure –also known as the schema – are data points. They designate the individual data set and consist of measurement, tag set, field set and the timestamp. Data points get their uniqueness from the timestamp and the series to which they belong. A series is a collection of data points that have measurement, tag set and field key in common.
In order to illustrate this structure in practice, we have developed a short use case for an energy producer with a biogas plant using fictitious data.
<measurement>[,<tag-key>=<tag-value>...] <field-key>=<field-value>[,<field2-key>=<field2-value>...] [unix-nano-timestamp]
engine generator_id=1234 malo_id=123456789 unit=kWh power_production=137.4 rpm=2988 max_delta=112.6
(using von InfluxDB v1.8 as an example)
In this example, the measurement (engine) collects data on the generators. Under tag key (engine_id), all generators that produce electricity appear in the tag value. Since tag keys are excellent for querying metadata, we have added two more. One tag key (malo_id) to identify the market location, in order to know for which market location the respective generator produces the electricity, and the other tag key (unit) for the unit in which the energy production is measured. The actual measured values are found in the field values. Here, too, we have set three field keys. The first field key (power_production) measures the energy production, the second field key (rpm) the speed of the generator and the last field key (max_delta) determines how many additional kWh the generator can still deliver up to the maximum energy production.
Retention policy and continuous query
In Retention policy (data deletion) and Continuous query (data combination), InfluxDB provides two valuable tools for the management and organisation of particularly large amounts of data.
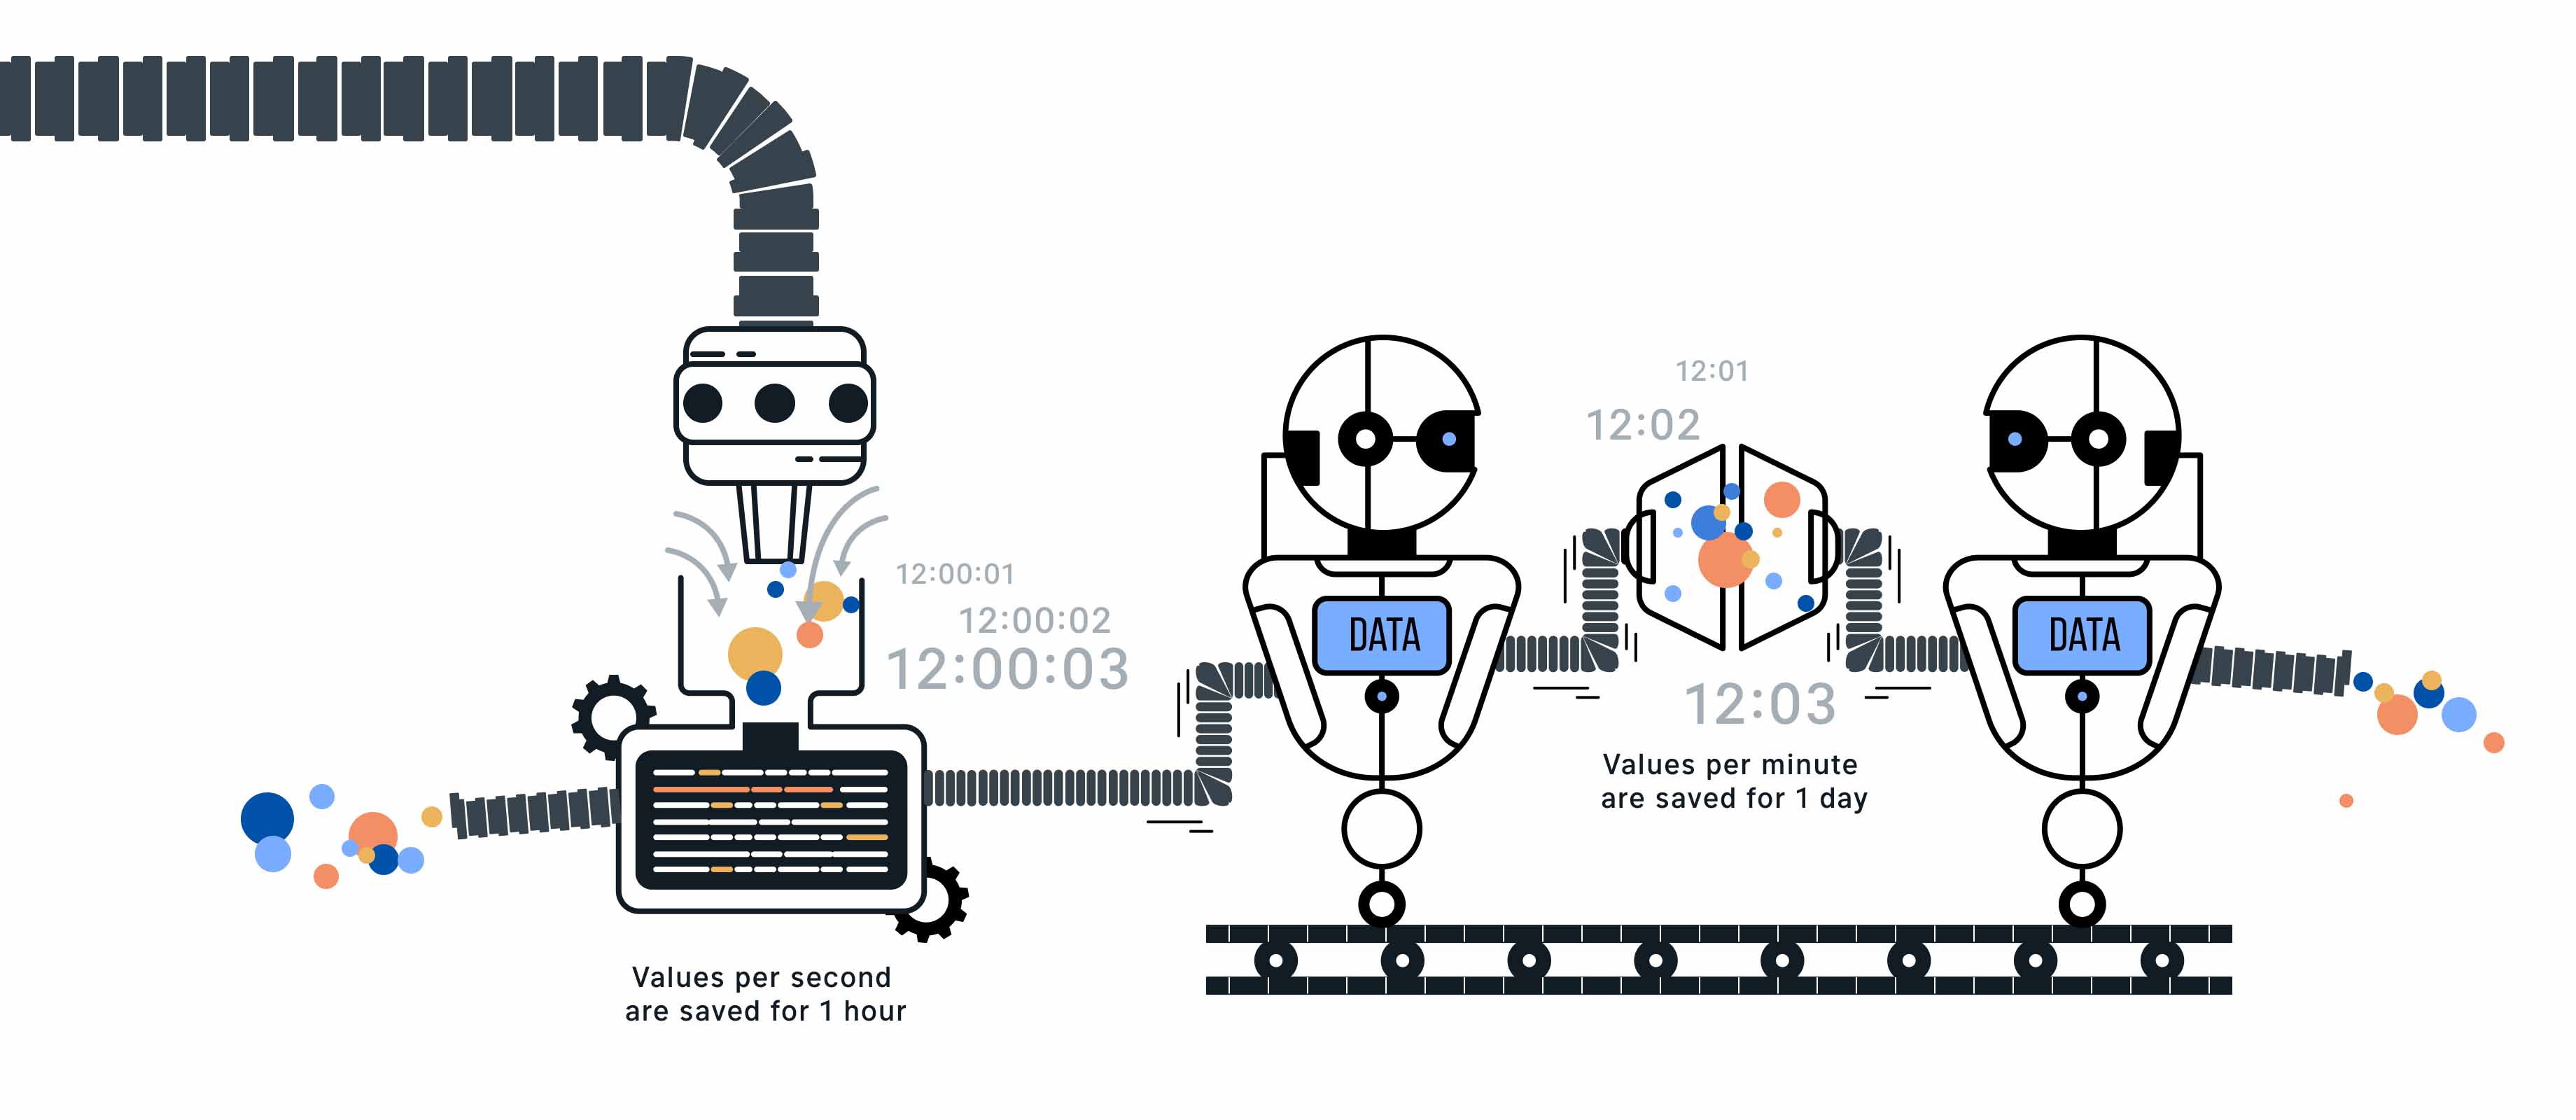
Retention policies are unique to each database and describe how long data should be retained. InfluxDB compares the timestamp of the server with the timestamp of the data and deletes all data that is older than defined by the retention policy.
Continuous queries are queries that are executed automatically and regularly and store the results in a new measurement. To execute a continuous query, they require a function in the SELECT clause and must include a GROUP BY()time clause. InfluxQL offers a variety of functions that are grouped under the terms aggregate, select, transform and predict.
The following graphic illustrates the effects of a retention policy and continuous query. The period of data points to be deleted by the retention policy is continuously extended. For the continuous query, the aggregate function mean() is applied to condense the data points, which combines more and more data into a single data point.

However, in order to collect data or to be able to transmit data to InfluxDB, it needs a separate application. Telegraf is an example of an application that was developed by InfluxData specifically for this purpose.
Telegraf
Telegraf is a plug-in controlled server agent for collecting and sending metrics and events from databases, systems and IoT sensors. The application is written in Go and compiles to a single binary with no external dependencies. The plug-in system covers a variety of ways to get data (third-party APIs, StatsD, Kaftka, MQTT etc.) or output data (InfluxDB, OpenTSDB, Kafka, MQTT etc.).
Lastly, we would like to return to our biogas plant example and illustrate the interaction of data source, Telegraf, database (InfluxDB) as well as output.
Architecture
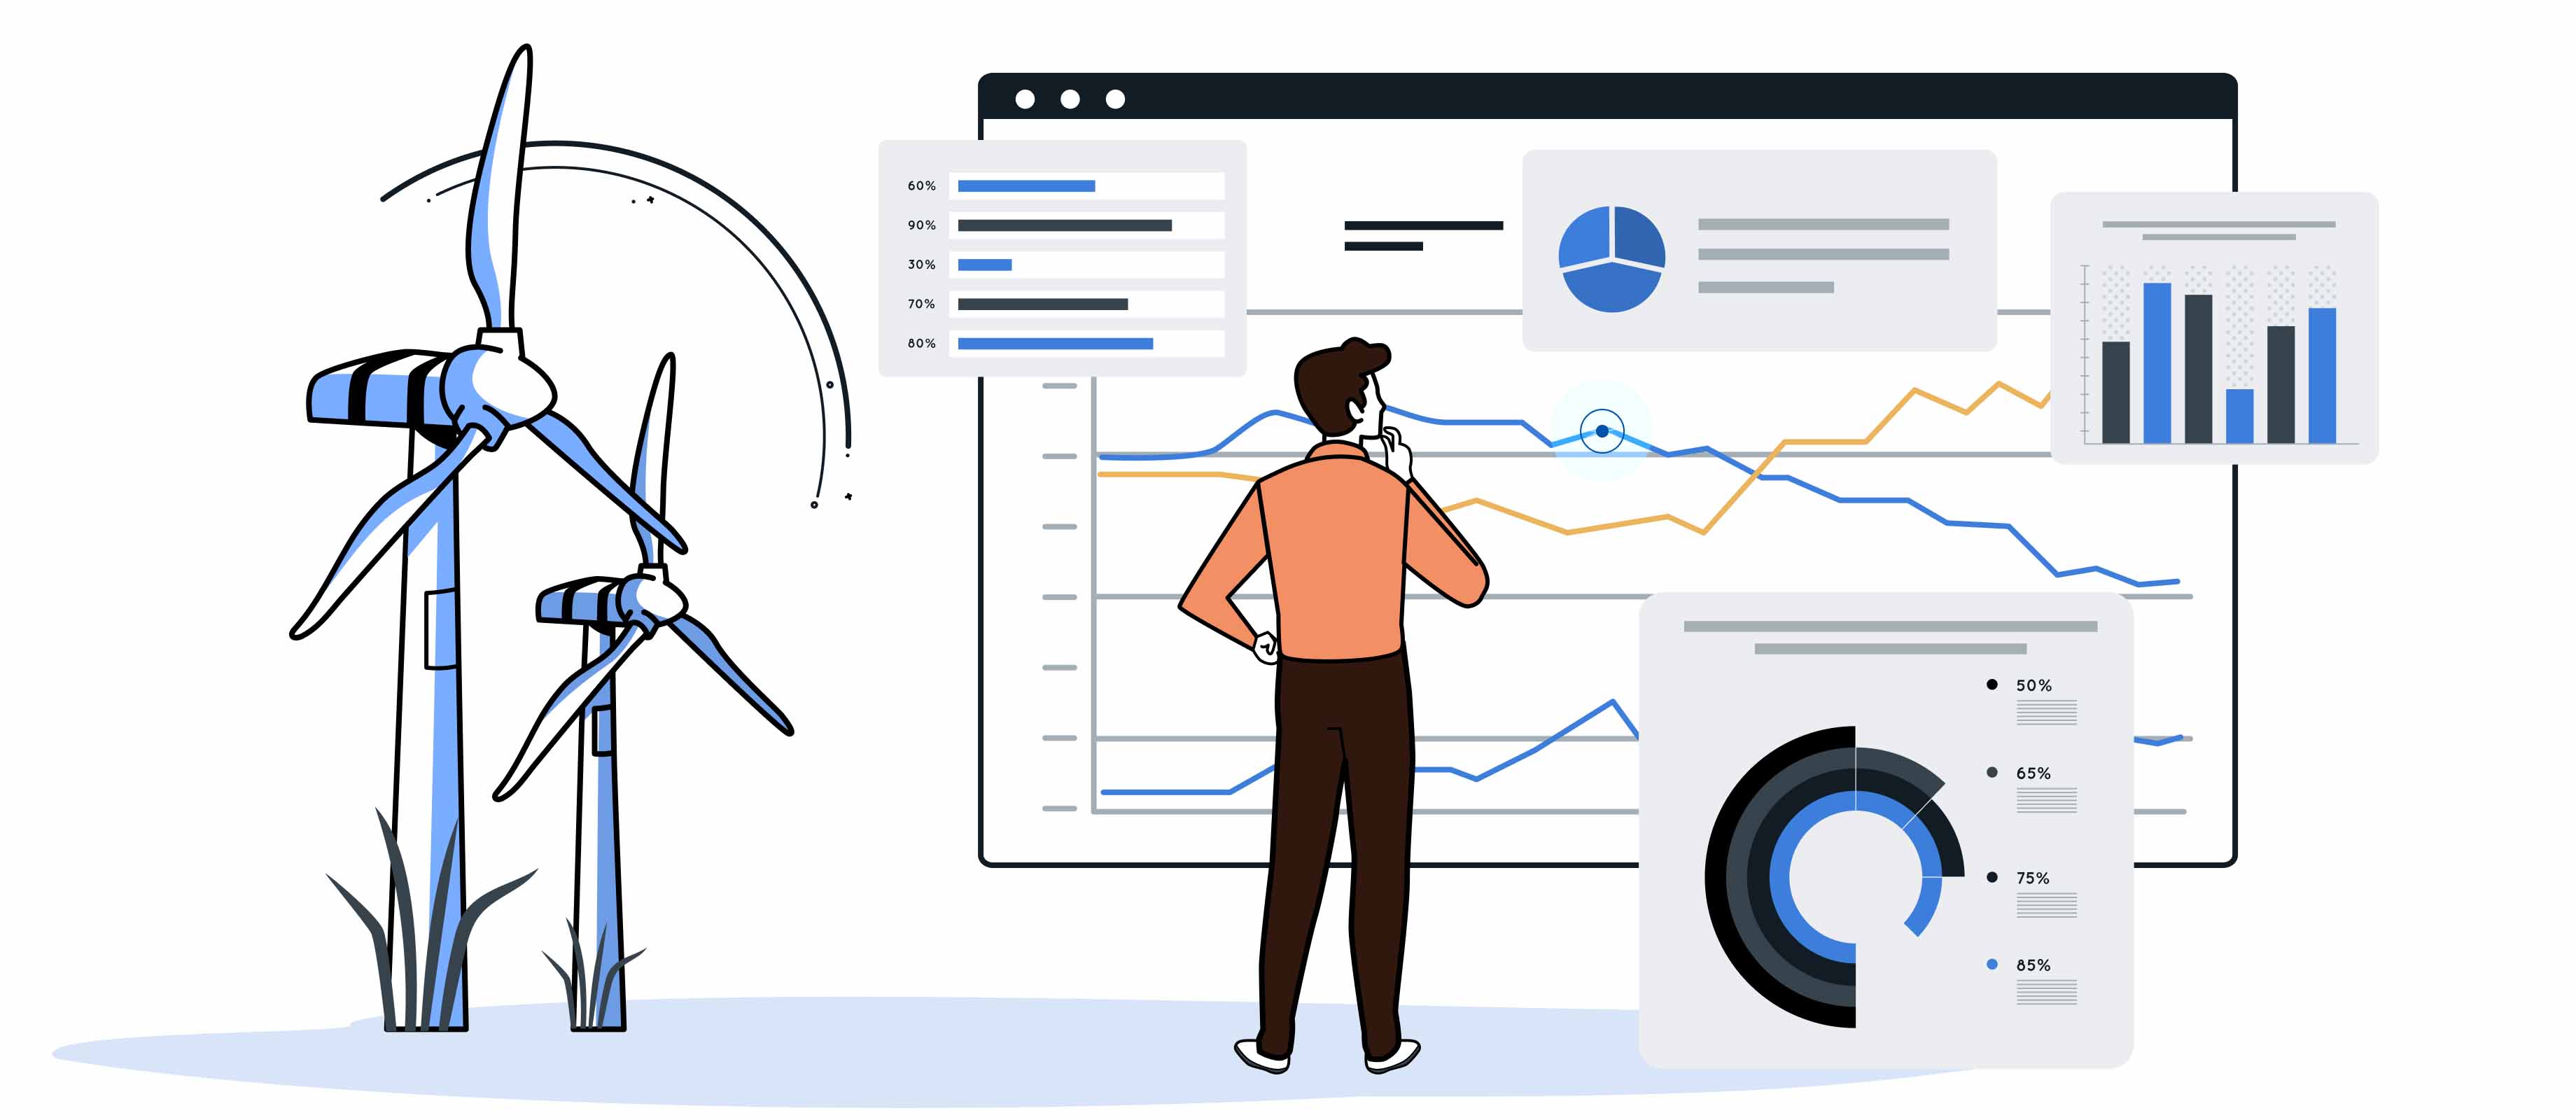
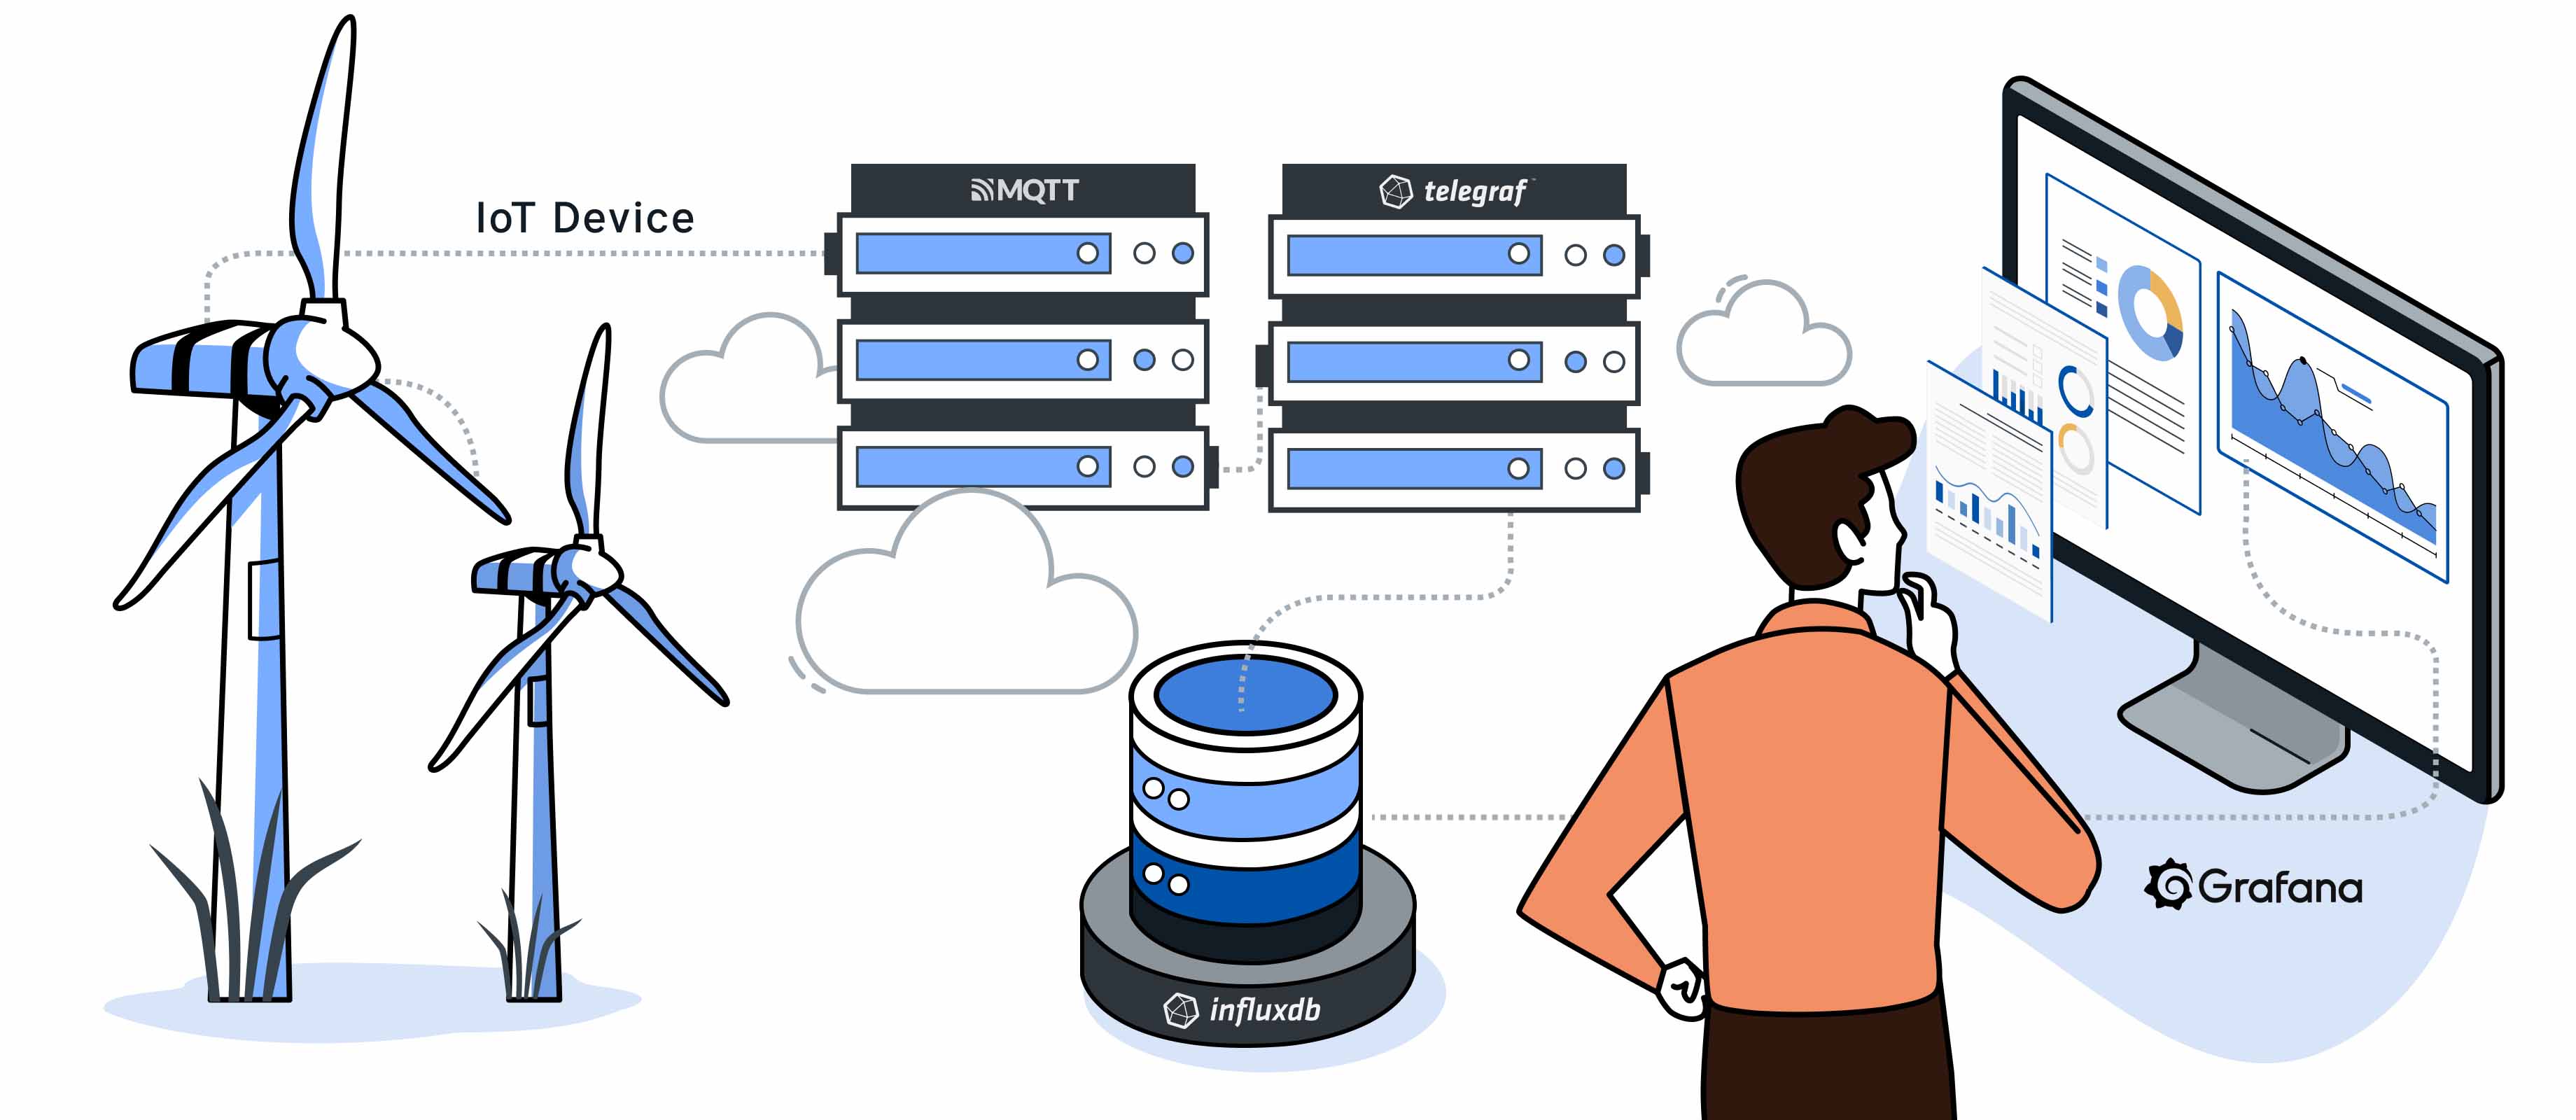
In the beginning, there is the system for energy production or consumption, which provides the data for InfluxDB. Using special hardware (sensors, tachometer) and software, the measurements (energy production, engine speed, delta to maximum energy production) are taken and transmitted to an MQTT broker. Telegraf is programmed so that the application retrieves the data and then passes it on to InfluxDB. Data can be displayed to the energy producer via a portal in various forms such as diagrams. This does not always require a separate application; tools such as Grafana are also able to display the data visually.

The areas of application for InfluxDB are versatile. Due to its structure and functions, which are designed to work with a large number of time series, it is worth giving InfluxDB or another time series database a try for a project or two.
Sources:
Data Science
Learn more about our services